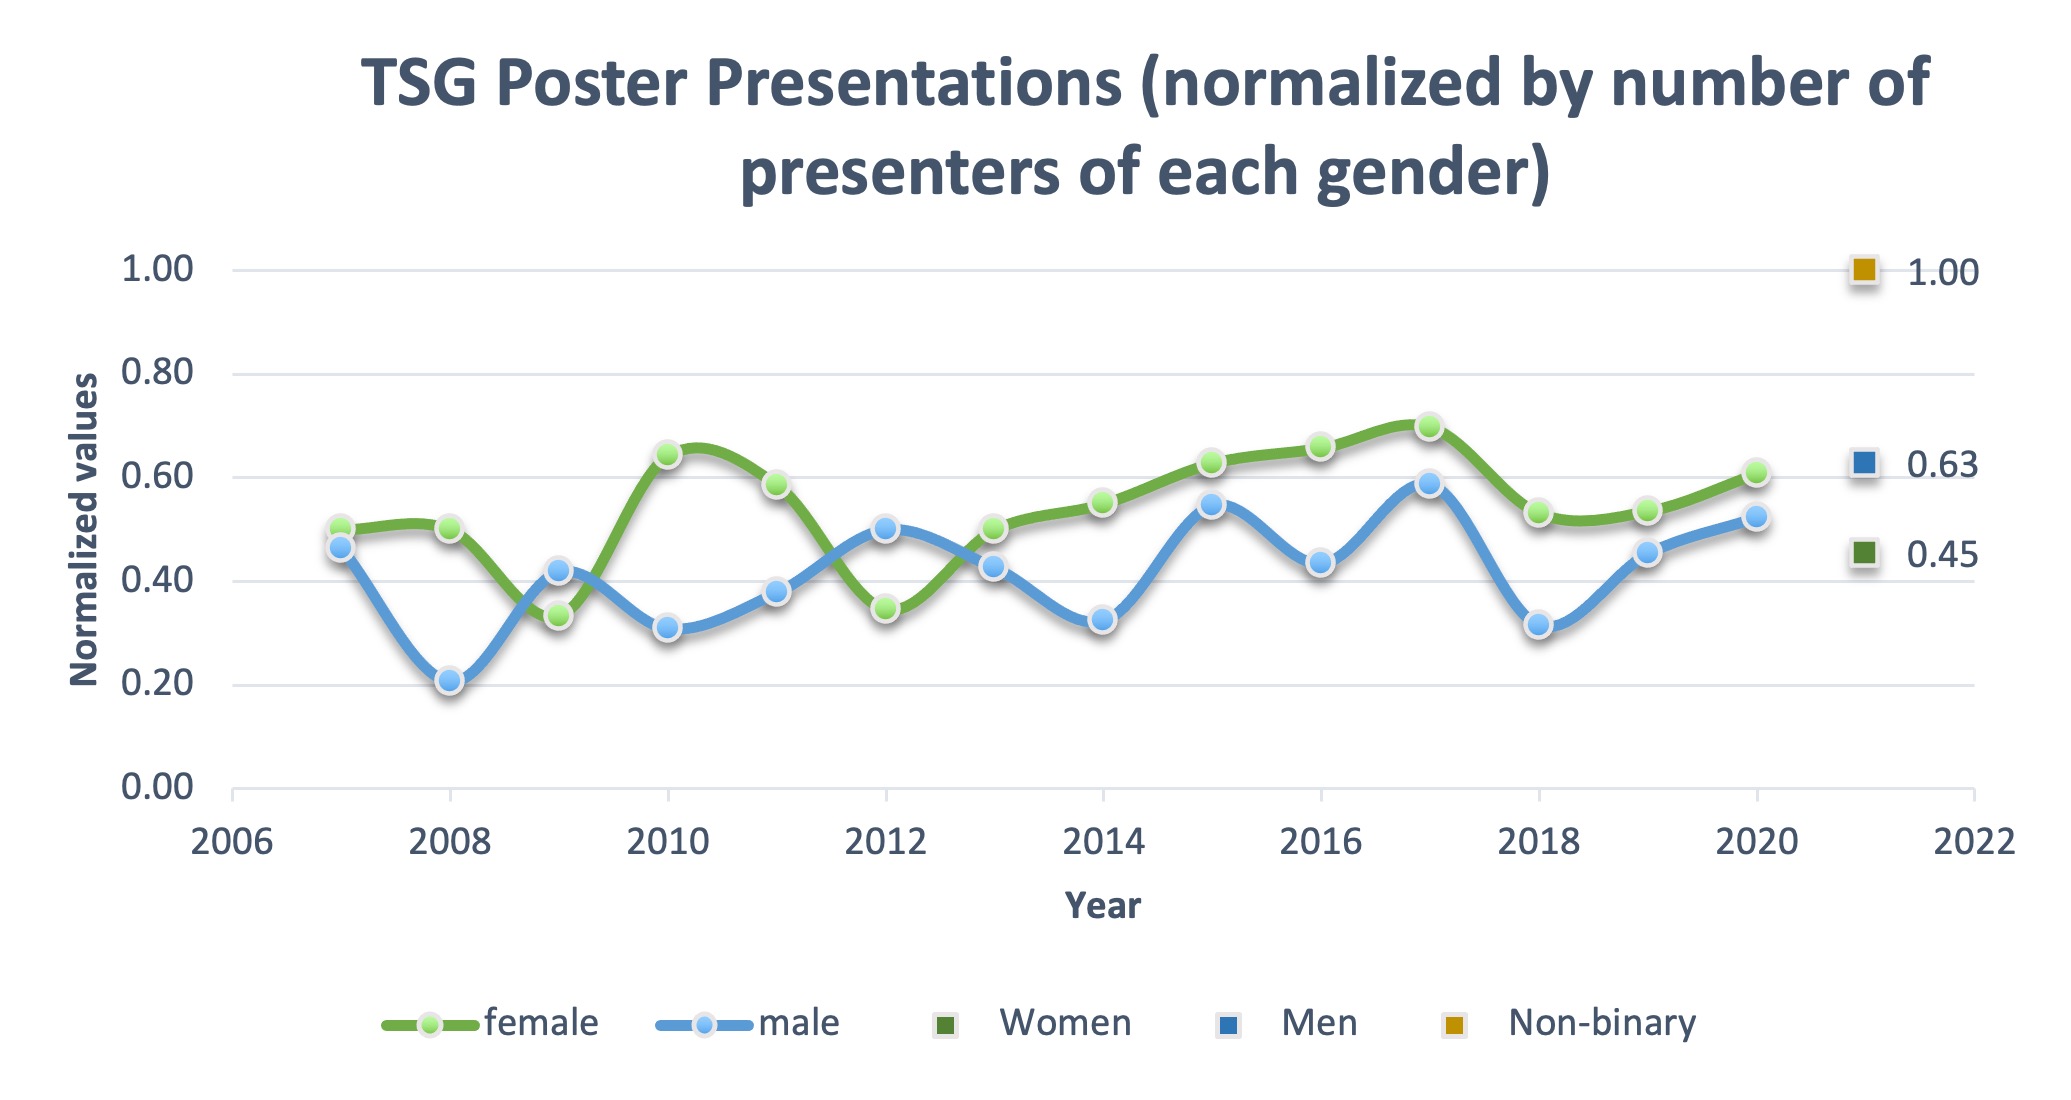
Figure 3 – Normalized gender split for poster presentations at TSG meetings from 2007-2021. Values are normalized by the total number of women or men presenting each meeting. Circular data points are historical data, square data points are from this survey.
Follow Us!