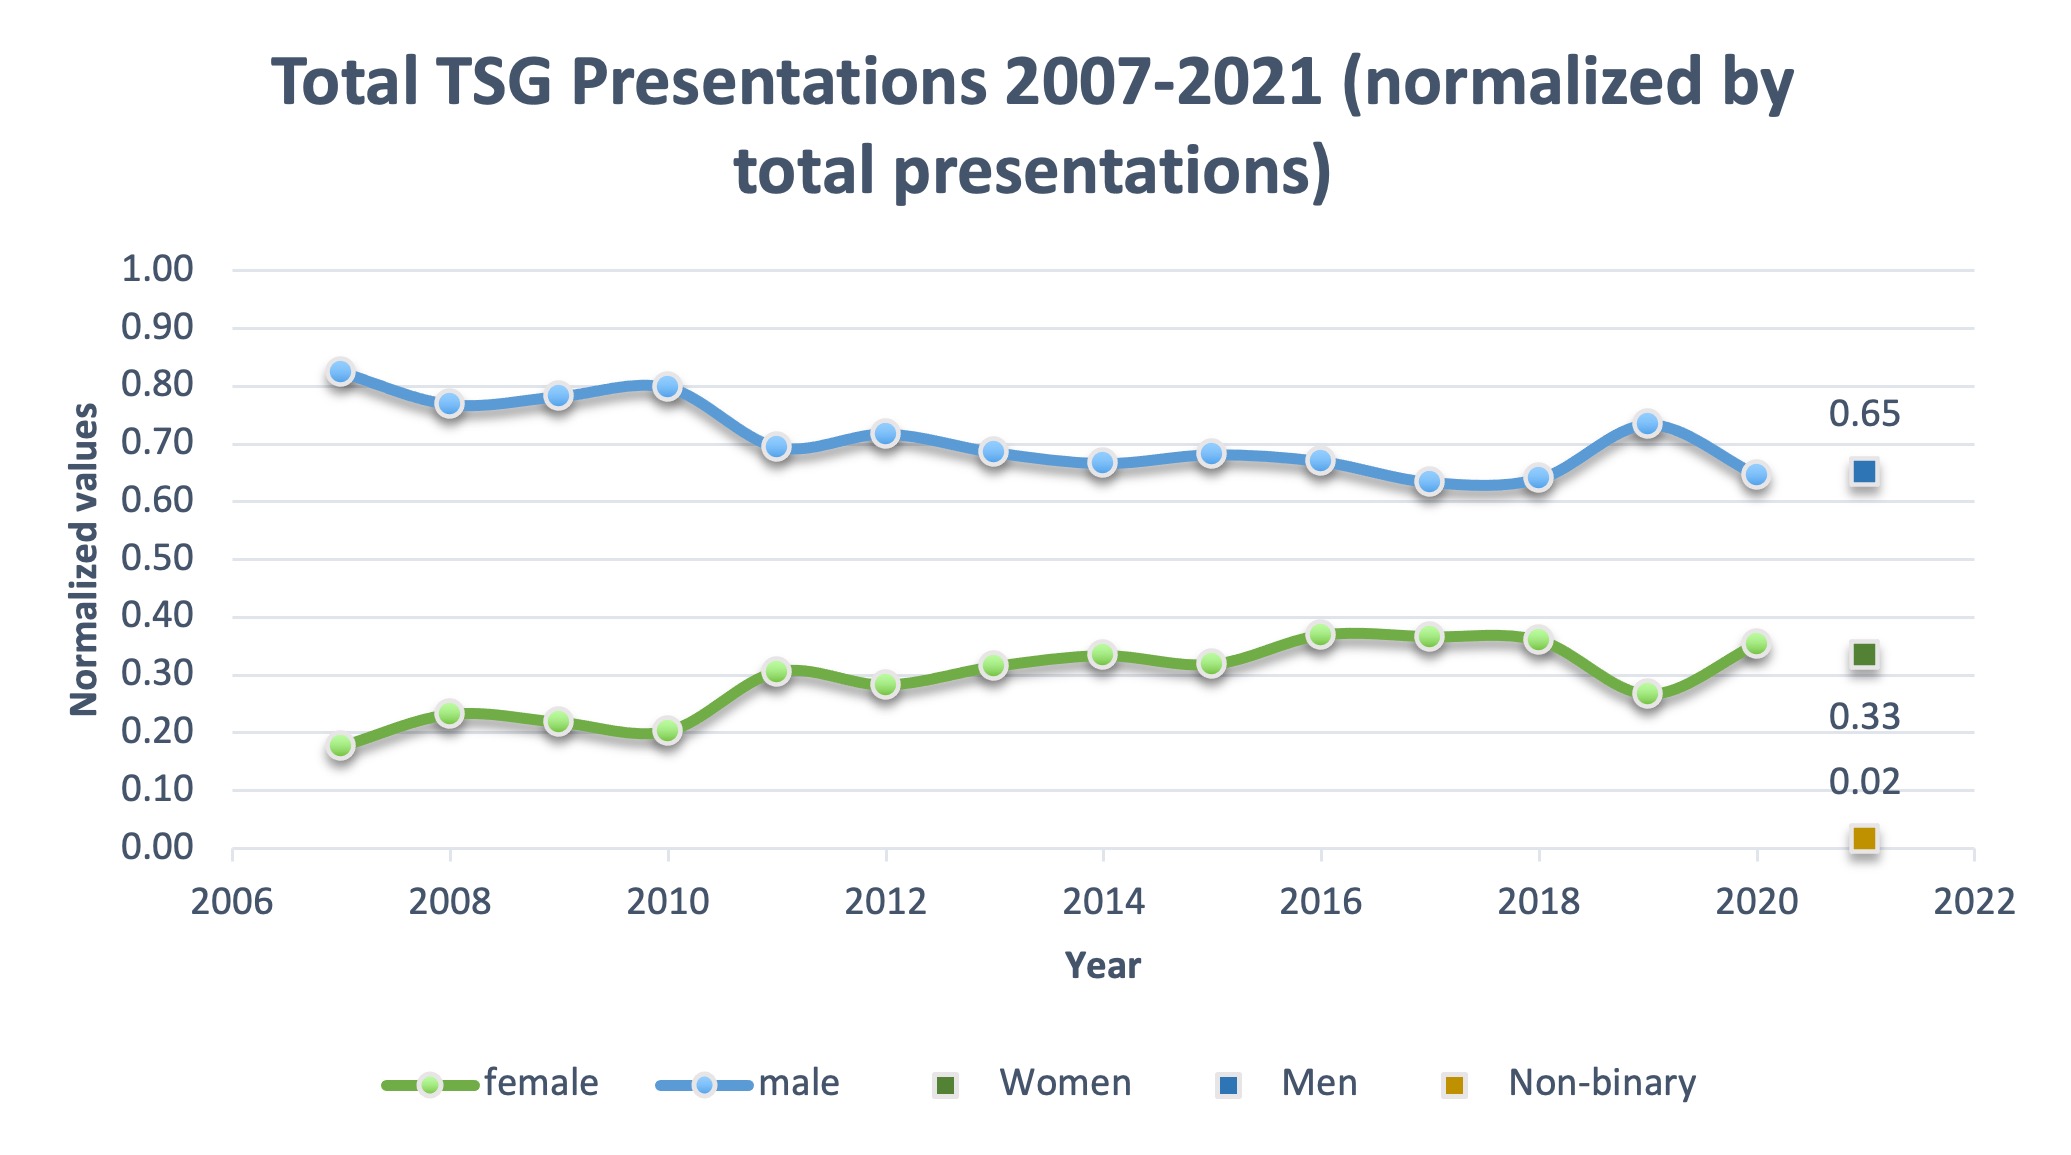
Figure 1 – Gender split for all presentations at TSG meetings from 2007-2021, as percentage values. Circular data points are historical data, square data points are from this survey.
A specialist group affiliated to The Geological Society of London
Figure 1 – Gender split for all presentations at TSG meetings from 2007-2021, as percentage values. Circular data points are historical data, square data points are from this survey.
© 2026 Tectonic Studies Group
Theme by Anders Noren — Up ↑
Follow Us!