In 2021, the TSG Annual Meeting was held online due to the coronavirus pandemic. To build on our 2019 gender diversity report, we wanted to begin gathering diversity data proactively and anonymously. The 2019 report gathered historic binary gender data based on personal contact, webpages and/or social media accounts – this was a good starting point to understand historic gender diversity. However, this approach is damaging for people of marginalised genders and cannot be used to capture other indicators of diversity. We had hoped to proactively gather diversity data at the point of abstract submission, but this was unfortunately not possible. Therefore, we ran an anonymous survey of the presenters and session chairs in March 2021, using Google Forms. The data in this post is based on the 73 out of 115 (63% response rate) responses we received, therefore the data presented here is not a complete picture.
The survey was designed to specifically gather data on gender (i.e. man/woman/non-binary), and not sex (i.e. male/female/intersex). Additionally, the survey captured a broader sense of diversity than the previous survey which considered gender alone. This survey collected data on career stage, sexuality, disability, ethnicity and geography. The impacts of different identities are experienced intersectionally (e.g. the experiences of Black women are not the same as the experiences of white women in our society). However, we have chosen to present the answers from the different questions of our survey independently to avoid identifying individuals in our small community.
We also summarise the responses to the free text question of “Do you have any suggestions for how we can improve equality, diversity and inclusion across TSG?”. We also look back at the recommendations made in the 2019 report to determine whether there has been progress and suggest recommendations for future TSG conferences and organisers.
Gender
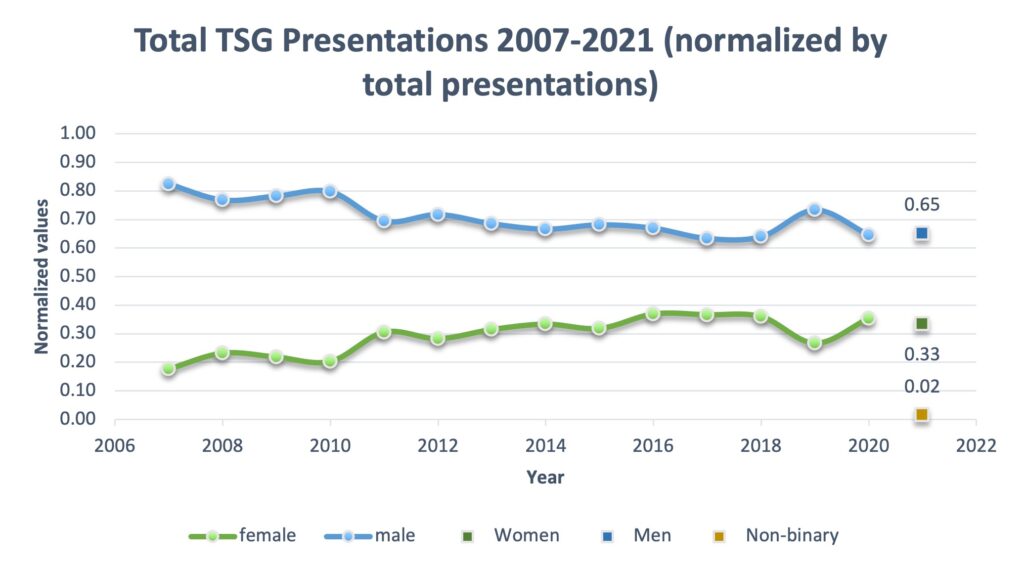
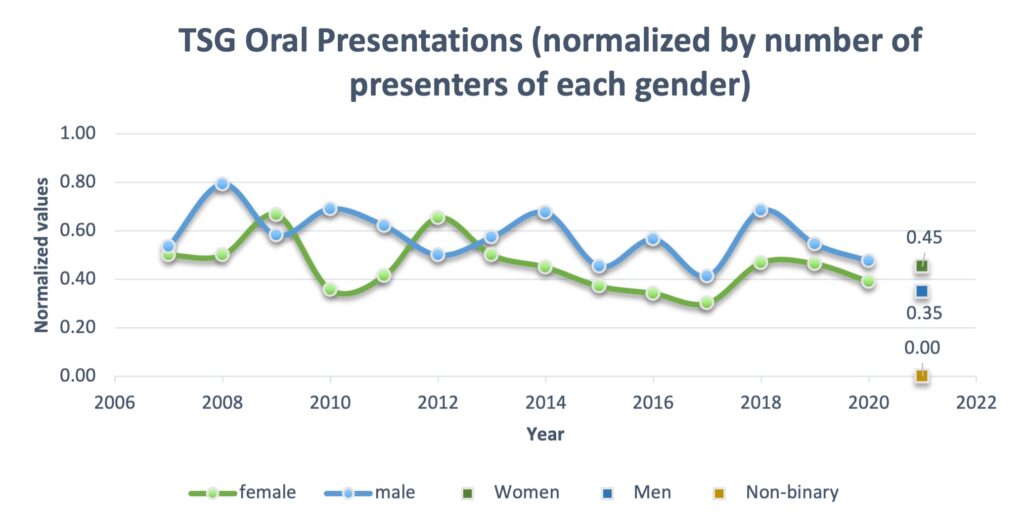
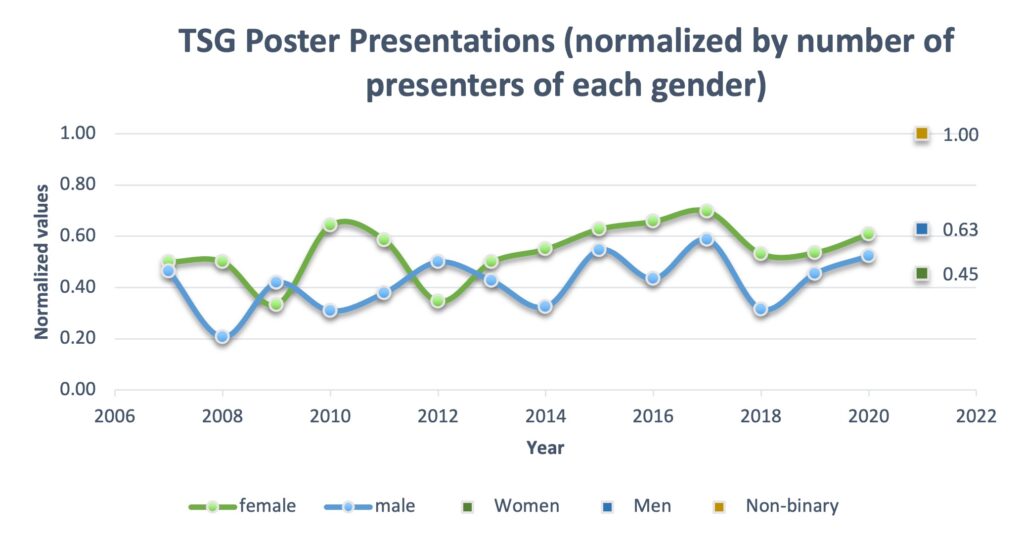
The gender data collected builds on the data previously gathered in the 2019 report. Figure 1 shows the gender of presenters normalised to total presentations. Figure 2 and Figure 3 show the gender of oral and poster presenters normalised to the proportion of female/male attendees. Overall, 63% responders identified as men, 36% as women and 1% as non-binary.
The gender data of presenters and session chairs can be summarised as follows:
- 40% of oral presenters (including invited speakers) were women
- 26% of poster presenters were women, and 3% were non-binary
Additionally, the organising committee (who were the session chairs) were balanced between men and women, and from a range of career stages.
The survey question focussed on gender and allowed multiple options to be selected, e.g. a transgender woman could have selected “transgender” and “woman”. One respondent commented on this question as being unclear – we made a mistake when designing the survey that it wasn’t clear that multiple options could be selected and we will improve this in the future.
Career Stage
- 45% of the responders were PhD or undergraduate/Masters students, and 48% of the oral presentations were given by these groups
- 33% of the responders were ECR’s (defined as <7 years since PhD completion), and 36% of the oral presentations were given by ECR’s
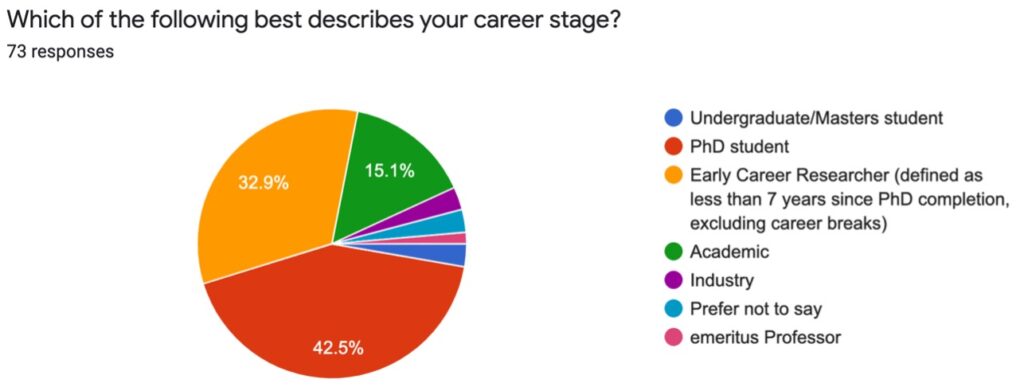
TSG has always tried to actively promote engagement with PhD and ECRs and allow these groups the opportunity to present their research in a supportive environment. The data above shows that the majority (78%) of the respondents are students or ECRs, and these groups make up a similar proportion of the oral presentations.
Disability/Neurodivergent

7% of the respondents consider themselves to be disabled or neurodivergent (autism/ADHD/dyslexia/dyspraxia). For comparison, in the UK 5% of academic staff (HESA) and 19% of working age adults (Scope), are classed as disabled. One respondent commented on improving accessibility, this year many aspects of conference organisation were delayed beyond the control of the committee. But in the future we will aim to allow more time for organisation and ensure that conference information is communicated in a clear and concise manner.
Sexuality
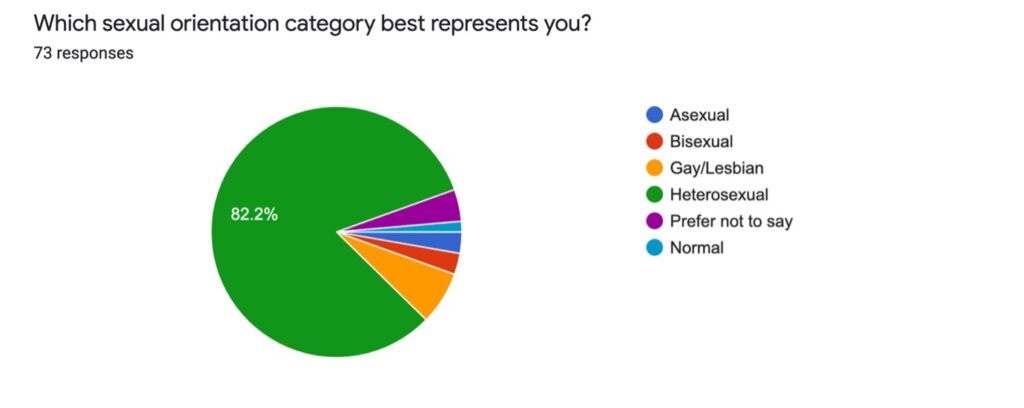
There were no comments/suggestions that related to sexuality. One responder answered “normal”, we cannot interpret what this means because “normality” is unique to individual cultures, society and individuals.
Ethnicity
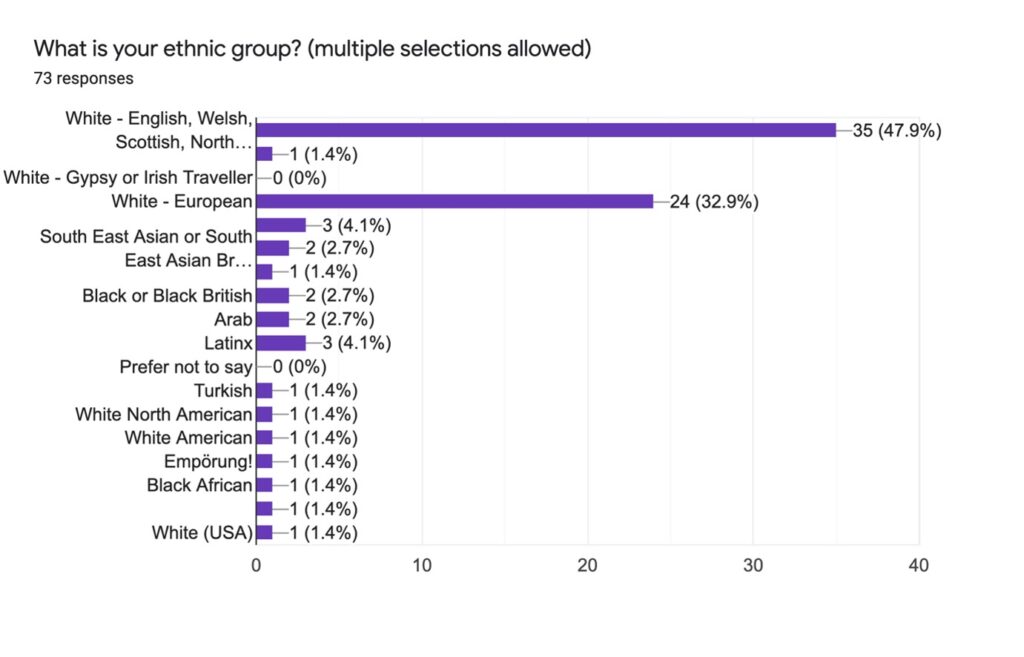
The ethnicity question was structured following guidance from the Office for National Statistics on the ethnicity options given, as TSG is a predominantly UK-based organisation. Multiple selections were allowed and there was the option for people to fill in their own description (as 7 responders did).
Location
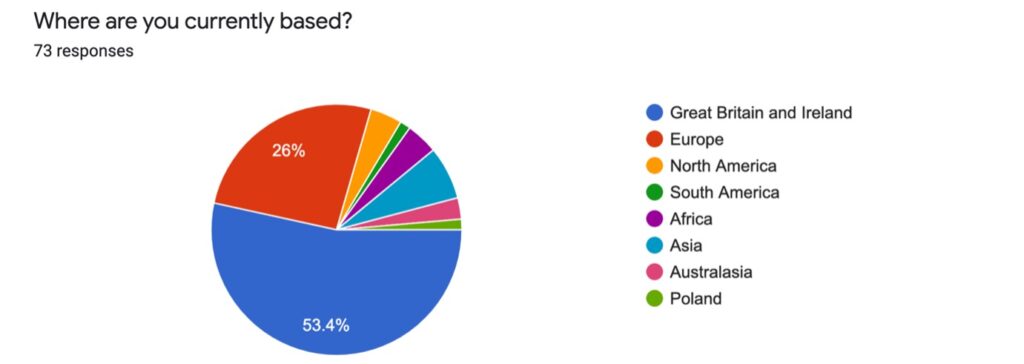
Usually TSG meetings are mostly made up of UK-based researchers, and it was noted this year that the online meeting format benefitted researchers from further afield to participate which enhanced the meeting. This came up twice in the comments from responders that the online format enabled wider global participations and this would be a benefit for future conferences. The committee were pleased with the online conference (and it seemed that many of the participants agreed) and we will certainly consider online/virtual formats for future conferences.
How are we doing and how can we improve?
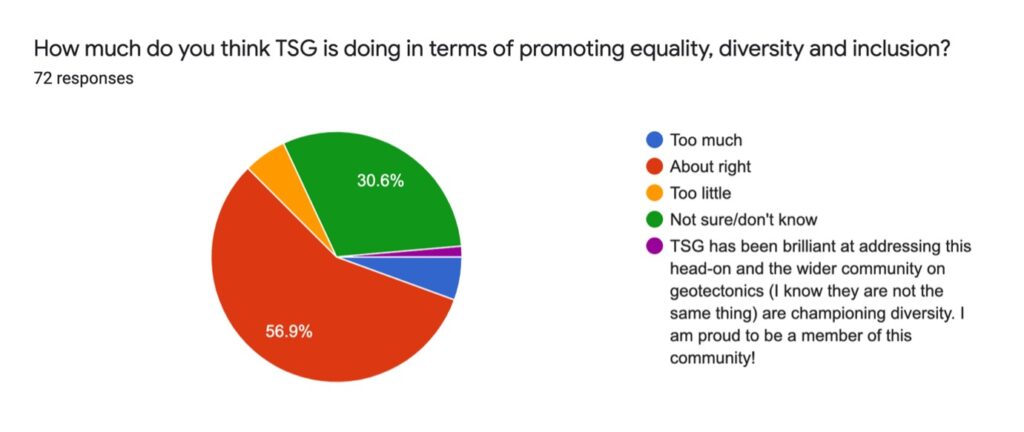
The majority of responders think that we are doing about the right amount for promoting equality, diversity and inclusion (EDI).
This year, the committee organised the annual conference and therefore we were able to take the opportunity to self-audit again the recommendations from the 2019 report (Bubeck and Farrell, 2019).
Committee action points
Code of conduct: share the CoC on the registration site
- The code of conduct was not displayed on the Geological Society registration site. It was mentioned in the Chair’s opening welcome to the meeting.
Future action – display a link to the code of conduct at the point of abstract submission or registration. Include the code of conduct within the abstract volume/conference handbook. The code of conduct should also be verbally referenced by the convenors at the beginning of each day of the conference.
Prizes: encourage nominations for women and highlight that anyone can nominate for the Ramsay medal when being advertised. Organise a diverse (gender and career stage) group of judges
NB we did not collect gender data specifically on the prize winners or the judging panels, therefore we don’t report any specific data here. In the future we will collect this data.
Future data collection: proactive collection of diversity data and determine dataset storage policies
- We collected anonymous data after the meeting using Google Forms, but only received 63% response rate, therefore the data presented here may be incomplete.
Future action – explore methods to proactively collect and anonymise diversity data (e.g. at the point of abstract submission) and investigate GDPR compliance.
Advertising of vacant committee positions (a suggestion from 2019 AGM)
NB – Secretary, 2 x Postgrad reps and 2x ECR reps replaced in at 2021 AGM
- This was questioned during the 2021 AGM
- Advertised via the GeoTectonics mailing list on 9th November 2020
- Posted on the TSG website on 6th November 2020
- No advertising via Twitter
Future actions – advertise the available roles on the conference website and/or as part of the registration process. Develop infographics for roles to use on social media to promote engagement. More regular advertisements leading up to the conference through Geo-tectonics mailing list and social media. Enable people to express an interest in committee positions through a form on the TSG website.
Recommendations to Organisers
Presentation schedule: produce a diverse group of potential speakers
- The gender balance of oral presentations given by women/non-binary was good (43%)
Session chairs and organizing committee: male/female session chairs should be approximately equal, allow ECR’s to convene sessions
- The meeting was convened by the TSG committee which has a good balance of men/women and career stage.
Keynote speakers: invite diverse (gender and career stage) speakers
NB- The keynote speakers were part of the session to remember Patience Cowie
- 2 of 5 keynote speakers were women
- 2 of 5 keynote speakers were ECR’s
Childcare facilities: provide facilities and advertise in advance of submission deadline
- Not applicable to an online conference
- However we note that there were slightly less women presenting (normalised to total presenters) which may be due to the impacts of COVID (“Women took on the bulk of children during lockdown” The Guardian)
Future action – we could investigate the option of recording talks and making presentations available via a TSG Youtube channel. This would make the presentations more accessible to those who struggle to attend the live meeting, whether due to caring responsibilities or time zone differences. We could also have pre-recorded talks or remote presentations at future in-person to give additional flexibility.
Single day registration:
- The cost of the conference was £10 (free for PhD students) for all four afternoons of the conference. No single day registration offered, but the low cost is unlikely to have discouraged people from attending.
Data compilation and write-up by Dr Zoë Mildon, Dr Dave McCarthy and Chris McMahon. Thanks to Dr Eleanor Armstrong, Dr Nuzhat Tabassum and Anna Hicks for their input on survey design and presenting the results.
Follow Us!